One-liners to plot your internet speed
Posted: March 23, 2020
Category:
(none)
My ISP has been promising me a certain Internet speed, which is surprinsingly not respected. I wrote these simple one-liners to record and plot the internet speed over time, and thought it could be useful.
Record speeds
This will run speedtest-cli every 15 minutes (900 seconds) and writes the results in a CSV file.
apt install speedtest-cli
watch -n 900 "speedtest-cli --csv | tee -a speedtest.csv"
Stop the script with Ctrl+c whenever you feel it collected enough data.
Plot speeds over time
And a not-so-readable Gnuplot program to plot this data:
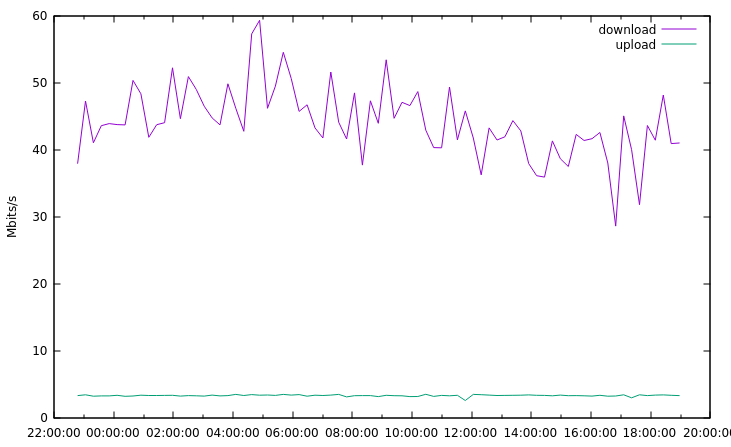
gnuplot -e 'set datafile separator ","; set xdata time; set timefmt "%Y-%m-%dT%H:%M:%S"; set format x "%H:%M:%S"; set ylabel "Mbits/s"; plot "speedtest.csv" using 4:($7/1000000) with lines title "download", "" using 4:($8/1000000) with lines title "upload"; pause -1'
Speeds are stored in bits/s, so we divide them by 1 million to get Mbits/s.
The 4th column is time, the 7th is download speed, and the 8th is upload speed.
The gnuplot command will open a window, which you can resize before exporting the result.
And voilà: